News Editor
It has only been a few months since voters across the country went to booths and voted on candidates for all offices of government. However, it will not be long before the campaign signs and television advertisements start up again to mobilize voters for the midterm elections in 2014.
With every election comes the analysis of voter turnout data, a way to review how many voters actually show up to vote on Election Day. Analysis of this data can show trends, increases and decreases in voter turnout depending on the year and what offices are up for election.
Ashley Biser, an assistant professor of politics and government at Ohio Wesleyan specializing in contemporary political theory, identified four factors that can influence voter turnout in any election: institutional factors, election profile factors, luck and socioeconomic factors.
Institutional factors would include things such as if the state offers same day registration, if early voting is available, if there is automatic voter registration and even the factor that voting day is not on a weekend or a national holiday in America.
“We’re one of the few countries in the world that doesn’t have a national holiday for voting, or that doesn’t have it on weekends,” she said. “…and part of that has to do with the fact that voting in the United States is so much of a state issue and not a federal one. It’s a lot easier to put in place those kinds of rules when you’re dealing with a more unitary system or it can come straight down from the federal government and not be so much at the state level.”
For the election profile factors, Biser said those who study politics know general (presidential) elections tend to have higher turnout than midterm elections because of the attention they get and because there are sometimes big issues on the ballot to be voted on.
The greater attention would also lead to more get out the vote efforts by various campaigns to try to increase voter turnout. Luck factors, such as what the weather is in a given area, can also influence election turnout.
Socioeconomic factors include variables like whether or not the parents of the voter voted themselves and the income levels of the person can also influence if the person goes to vote.
The Data
The voter turnout data used in this story is from the United States Elections Project, which, according to its website, is an information source for the United States electoral system with the mission of providing timely and accurate election statistics, electoral laws and research reports to inform the people of the United States on how the electoral system works, how it may be improved and how they can participate in it.
This data comes from the research of Michael McDonald, an associate professor at George Mason University and a non-resident senior fellow of the Brookings Institution, a nonprofit think tank based in Washington, D.C. The United States Elections Project website can be found at http://elections.gmu.edu/.
McDonald cites different ways to calculate the voter turnout rate depending on what portion of the population is used on the United States Election Project website.
The voting-age population (VAP) is found in everyone residing the in the United States 18 years of age and older. The voting-eligible population (VEP), on the other hand, encompasses the population that is eligible to vote, which eliminates non-citizens, felons and mentally incapacitated citizens.
He indicates on the website that VEP statistics are a more valid calculation for use over time and across states. The VAP statistics can be problematic when applied to states because the number of ineligible voters (felons, for example) is not uniform across different states.
Additionally, the data was condensed further into VEP highest office turnout rate, which is how many people voted for the highest office on the ballot (the governor or senator for midterm elections, and the president for general elections).
These statistics are turned in by every state; therefore, the traditional numbers reported of people who voted in elections, according to McDonald’s website.
National Turnout Rates
The data from the graph on McDonald’s website shows a decrease in the national VEP turnout rates of about 12 percent from the 1960s to the 1970s. While specific percentages were unavailable for the years prior to 1980, this decrease is clear on the graph. Since 1980, the percentages have steadily increased to percentages close to what they were in the 1960s and 1970s.
Biser said some of the drop could be attributed to general dissatisfaction with the government.
“…I think in general we see a sort of frustration with government, and I think it’s a frustration that many people can understand, with the real question about, ‘What are these people doing that’s going to affect my life?’” she said.
“There’s an incentive to be a free rider and to let other people, the people who are really invested, to let them be the ones to do the work.”
Joan McLean, an OWU professor of politics and government and former political advisor for Democratic vice-presidential candidate Geraldine Ferraro, said this drop could be partly due to the differences in the electorate. As the country passed laws giving younger people and minorities the right to vote, this increased the size of the electorate. However, she said it generally takes a generation for new members of the electorate to develop the habit of voting.
“So, I would speculate that could account for some of the decline, and then the bounce back could be that the issues of importance to these two voting groups, minorities and young people, have gotten much more play in the last decade or so,” she said.
“Then, when you see with the Obama campaign appealing to both of those groups, it begins to set a pattern of interest because we know what people do early on in their voting life is what they do later on.”
For general election years, the national average stayed within the low to mid-50-percent range in the 1980s and the 1990s.
The only exception is a spike in the 1992 elections, where the national average jumps from 52.8 percent in 1988 to 58.1 percent in 1992 and back down to 51.7 percent in 1996.
The 1992 election was the year when Bill Clinton ran as the Democratic Party candidate, George H.W. Bush ran as the Republican Party candidate and Ross Perot ran as an independent. Biser said Perot running as a third candidate could have had an effect on turnout.
“I think that it was a heavily contested election,” she said.
“There were choices and there was a third candidate, and that makes things more interesting. Our system is not designed to have third candidates do well. It’s designed for a two-party system, and it’s going to encourage a two-party system. I think another institutional factor is…often times places that have more parties on the ballot have higher turnout because you feel like you have more choices.”
The next major jump in the national average comes in 2004, where the VEP goes up to 60.1 percent. The percentage stabilizes and the final data available from the 2012 elections is a VEP of 58.2 percent.
McLean said the spike could have been due to amendments for same-sex marriage bans on state ballots in 2004, causing many more social conservatives wanting to go out to vote to get the amendments passed.
The national rates for midterm election turnout, however, are much lower than the presidential election years. Biser cited reasons why this is so much lower as well as the impacts statewide elections can have.
“I think there’s a lack of understanding in terms of the impact that statewide elections can have,” she said. “If you look at the Tea Party, if you look at other sort of movements, they’ve actually been very effective in local elections.”
She said the Christian Right, a right-wing political group, has been extremely effective in local contests like school board elections. She said local elections are also important because they give candidates practice in running an election.
“I think that a lot of times we only focus on the bigger elections when, in fact, there is a lot of underground work going on at the local level that we should pay more attention to,” Biser said.
McLean agreed with Biser’s notion of a lack of understanding in the impact of local elections.
“…Midterm elections, you have to be more deliberate in one of two ways: you accept the civic responsibility that voting is important or you’re moved to vote because one of the issues or candidates is important to you,” McLean said. “…The government that has the most impact on day-to-day lives is the local and state. Yet, it is the least paid attention to when it comes to voting and voter turnout.”
There is also less of a difference between the high and low points in turnout from 1982 to 2010, the years the data was available. The national average was at its high point in 1982 at 42.1 percent and at its low point in 1986 and 1998 at 38.1 percent.
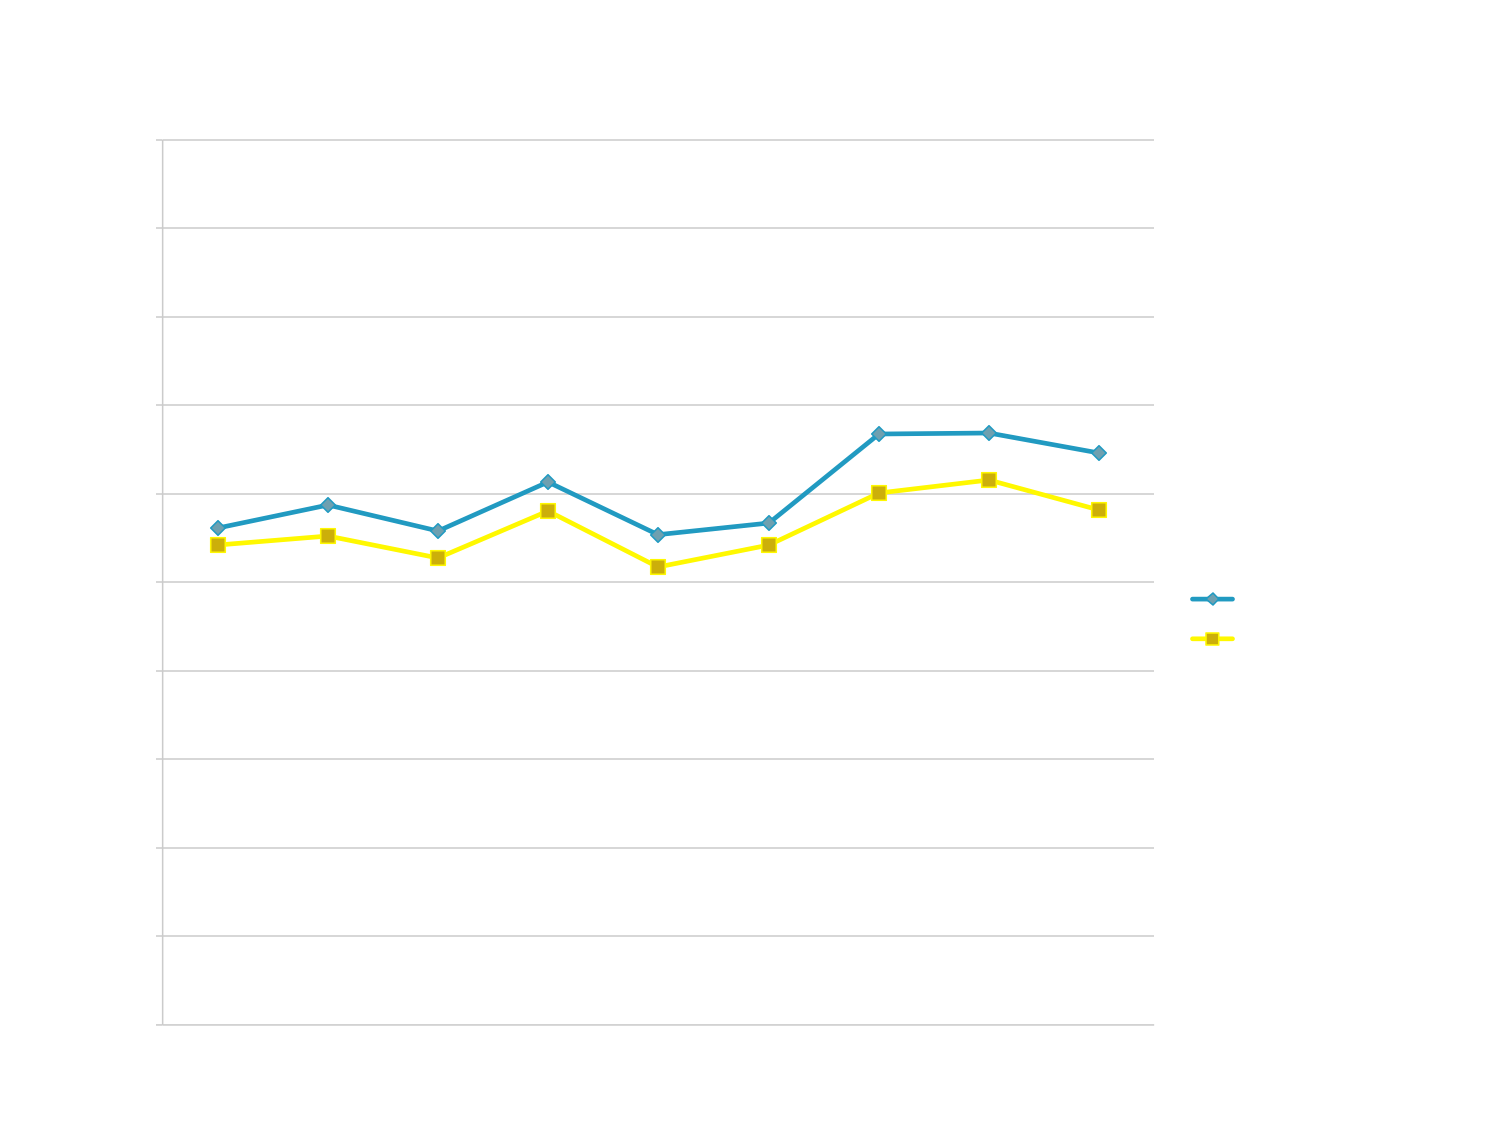
While Ohio VEP turnout rates for general elections had jumps in the same years as the national rates, the Ohio percentages are consistently higher.
National turnout rates hovered around the mid-50-percent range for most of the period between 1980 and 2000 with an increase to the low 60 percent range from 2000 to 2012. Ohio rates, however, started in the mid-50-percent range and increased to the mid-60-percent range in the years 2000 to 2012.
The closest the national turnout rates came to Ohio’s rates from 1980 to 2012 was in 1980 when the difference was 1.9 percent. From that point on, Ohio turnout rates were 2 percent or more above the national rates, even getting as much as 6.7 percent higher in 2008.
McLean described why Ohio being a swing state in elections can impact voter turnout percentages.
“Swing state means that it’s politically divided and open to voting, so you’re getting both party’s candidates,” she said. “People think their vote counts.
“We know people are more likely to vote when they think their vote counts or makes a difference.”
Biser agreed with McLean, going back to Ohio’s swing state status being a major institutional factor.
“What makes it (Ohio) a battleground state has to do with the electoral college, and so I think it makes sense that since your likelihood of having an impact on the election is much higher,” she said.
“We said in Bush versus Gore in 2000 that…all those questions about, ‘Will my vote count?’–that’s a really important question in swing states, and so I think that a swing state, one you know isn’t going to go one way or the other, makes a difference.”
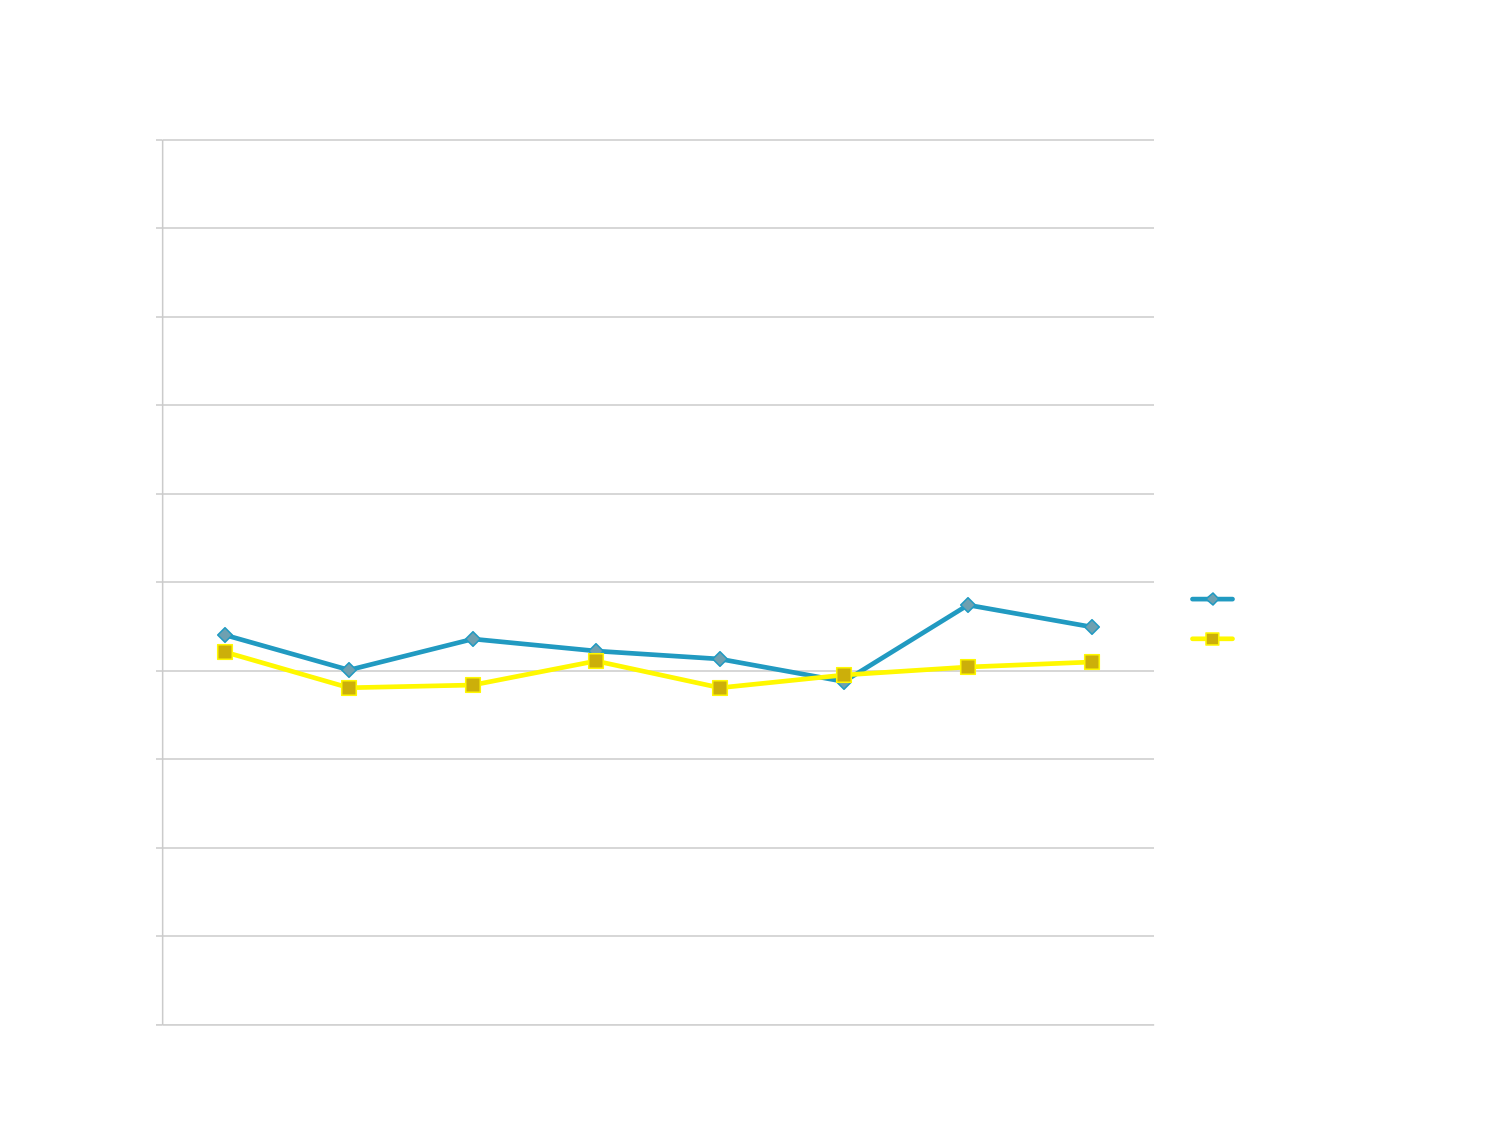
This holds true for midterm election years, as Ohio’s VEP rates stay in the low-40-percent range from 1982 to 2002, only dipping below 40 percent in 2002 at 38.80 percent.
However, the major difference comes in the jump after 2002 with VEP rates going up to 47.5 percent in 2006 and dropping slightly to 45 percent in 2010. The national rates did not experience a jump nearly as large as this in midterm election years.
McLean said part of the reason for some of the different jumps for Ohio and the National VEP rates for midterm elections is Ohio featuring a gubernatorial election in midterm election years. Not all states elect a governor at these times, so highly contested races for governor could be a reason for Ohio’s higher VEP rates in midterm elections.
Moving Forward
While the data shows the voter turnout rates have been steadily increasing since the 1980s, there is still only roughly 60 percent of the population showing up to vote nationally in general elections.
McLean said there are a few factors that could influence whether there’s an increase in turnout.
“Clearly, people have to think that voting matters and that they have choices,” she said. “…It would be very hard to guess the impact that political partisan politics and the election nearing politics is going to have. When you have high voter turnout, you have people who believe in the system.”
From a campaign and voter mobilization perspective, both Biser and McLean commented on the impact of get-out-the-vote efforts and technology.
Biser commented specifically on how after Republicans lost in 2008, the party learned they could not just rely on their base and that the Obama campaign had done a great job in terms of the ground efforts to get people to go vote.
McLean said technology has allowed for more sophisticated voter targeting and tracking for campaigns.
She said the down side to the all of the technology and voter mobilization efforts is “voter contact fatigue,” which could ultimately hurt the campaigns if they bother voters too much.
More to the Story
While all of this data points to voter turnout percentages increasing, there are still many factors to consider. One such factor, Biser said, is the use of VEP rates as opposed to VAP rates.
“This is already a smaller subset of people and that doesn’t include the people who have been disenfranchised through felon disenfranchisement and all of those things,” she said.
“I think that’s actually a really huge problem. I understand the reasons for it, but I also think that if you look specifically at the racial dimensions of felon disenfranchisement, it is a huge problem for civil rights in this country.”
There are many more factors that can be explored through this topic, such as looking at specific socioeconomic factors, using a median of national voter turnout rather than an average and comparing each state.
There are many reasons people show up to the polls some elections and not others.
While this covers the broad idea of the changes and truths about voter turnout rates, there is much more to the story to cover why many of the changes in turnout occur and what it means for the future.